Science Event Dashboard Test Suite
This example illustrates how to build a basic visualization tool using a publish-subscribe (pub/sub) architecture powered by a RabbitMQ event broker. It aims to help users understand how to visualize data flows within a test suite, with a focus on science event data.
Note
This example does not require the full NOS-T tools library, making it accessible for users who want to implement similar functionality without the overhead of the entire tools suite.
Introduction
NOS-T
The New Observing Strategies Testbed (NOS-T) is a computational environment designed to develop, test, mature, and socialize innovative operating concepts and technologies for NASA’s New Observing Strategies (NOS). It provides a robust infrastructure that enables the integration and orchestration of user-contributed applications to simulate system-of-systems test cases, allowing for true distributed control over constituent systems. This environment empowers principal investigators to conduct virtual Earth science mission simulations, systematically varying parameters to evaluate the effectiveness of proposed observing strategies. The resulting data and outcomes support the advancement of technology readiness levels and foster innovation in Earth science measurement techniques.
At the core of NOS-T is a loosely coupled, event-driven architecture (EDA), where applications communicate state changes through event notifications transmitted over a network. These events, encapsulated as message payloads, carry the necessary data to reflect system state transitions. This architecture enhances scalability and reliability by replicating event-handling functions across infrastructure instances, while maintaining modularity through a simple event-handling interface. NOS-T also aligns with service-oriented architecture (SOA) principles, as applications can trigger services in response to specific events.
A key component of this architecture is the event broker (or message broker), which centralizes communication by managing the exchange of event notifications between applications. Rather than requiring direct connections between all applications, each client connects only to the broker, simplifying the communication topology and improving system manageability. This design enables seamless coordination among user applications and the NOS-T manager application via a shared information system infrastructure, facilitating the execution of complex, distributed Earth science mission scenarios.
Science Event Dashboard Test Suite
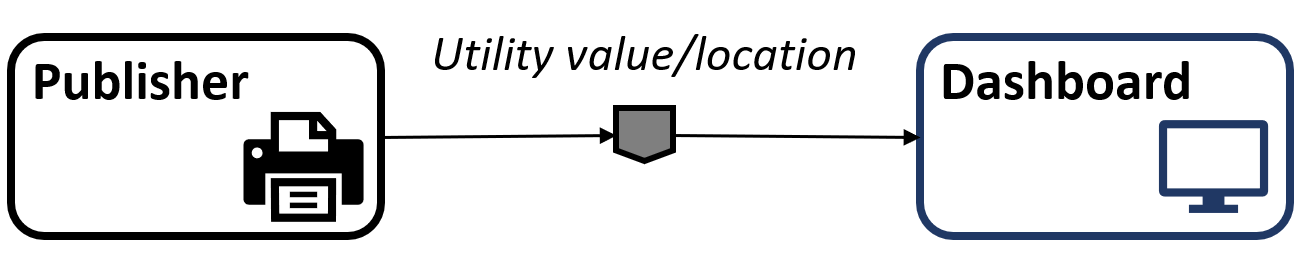
The Science Event Dashboard Test Suite is a simple example that not require the use of the NOS-T tools library. It contains two applications:
Science Event Publisher: Publishes science event data, including utility scores and random locations.
Science Event Dashboard: Visualizes the data published by the science event publisher using the Python Dash library.
The Science Event Publisher regularly publishes a utility score and globally distributed random location. The utility scores follow a parabolic curve from the apex down to zero for each time step.
The Science Event Dashboard is a basic dashboard which visualizes the utility and location information using the Python Dash library. The development team has found visualization tools like this dashboard to be very helpful to ensure that test behavior is as expected.
A basic graphical representation of the data flow is shown below.
Setup
This section will show you how to set up NOS-T assuming you are a beginner to both coding and the testbed. The setup phase involves:
Integrated Development Environment Installation
NOS-T Tools Installation
RabbitMQ Event Broker Setup
Repository Cloning
Integrated Development Environment Installation
An Integrated Development Environment (IDE) will make developing applications and interacting with NOS-T much easier. Below is a list of recommended IDEs:
Visual Studio Code (VS Code): Lightweight, highly customizable, supports many languages via extensions.
IntelliJ IDEA: Excellent for Java and Kotlin, with strong support for other JVM languages.
Eclipse: Popular for Java development, also supports C/C++, Python, and more.
PyCharm: Feature-rich Python IDE by JetBrains, great for web development and data science.
Note
Users are encouraged to use VS Code due to its lightweight design, ease of setup, and strong community support. It also offers built-in support for Jupyter notebooks, making it especially helpful for getting started with NOS-T development.
NOS-T Tools Installation
Although the Science Event Test Suite code does not require the full NOS-T Tools library, it is recommended to install the library to simplify installation of dependencies for this test suite.
The NOS-T Tools library is available on PyPi and can be installed using pip, the standard package manager for Python or conda. Below are the instructions for both methods.
Pip
To install NOS-T tools using pip, follow these steps:
Upgrade
pipto the latest version:
python -m pip install --upgrade pip
Install NOS-T Tools:
python3 -m pip install nost-tools
To install additional libraries required to run the NOS-T Tools examples:
python3 -m pip install "nost_tools[examples]"
Conda
For instructions on how to install Conda, see the: Conda documentation.
To install NOS-T tools using conda:
Create a new conda environment (recommended):
conda create -n nost python=3.11
conda activate nost
Install NOS-T tools:
python3 -m pip install nost-tools
To install additional libraries required to run the examples:
python3 -m pip install "nost_tools[examples]"
Note
Following the instructions above will install the Python packages that the test suite depends on to run. The details of these dependencies, including version numbers, can otherwise be found in the requirements file.
RabbitMQ Event Broker Setup
Refer to the RabbitMQ Broker on Local Host guide for instructions on how to set up a RabbitMQ event broker locally.
Important
The test suite uses a RabbitMQ event broker to facilitate communication between applications. Ensure that your RabbitMQ broker is running and accessible before proceeding with the test suite.
Repository Cloning
The recommended way to access the example code is by cloning the NOS-T Tools repository from GitHub. If you’re unfamiliar with how to clone a Git repository, you can find detailed instructions here.
Clone the repository:
git clone git@github.com:code-lab-org/nost-tools.git
If the above fails, you can also try the HTTPS version:
git clone https://github.com/code-lab-org/nost-tools.git
This will create a directory called nost-tools in your current working directory. Inside this directory, you will find the example code under the examples/scienceDash/ folder.
Note
More in-depth descriptions of what the code is doing can be found here: Science Event Dashboard.
Component Applications Overview
The Science Event Publisher and Science Event Dashboard applications are the two main components of this test suite.
Science Event Publisher
The Science Event Publisher is responsible for generating and publishing science event data, including utility scores and random locations. It uses the RabbitMQ event broker to send messages to the dashboard application.
The first section of the code includes import statements that bring in the necessary dependencies for building the publisher application.
import json
import time
from datetime import datetime, timedelta

import pika
from dotenv import dotenv_values
from numpy import random
Following the imports, the code establishes a connection to the RabbitMQ event broker using the provided environment variables in a .env file. It uses the pika library to create a connection and a channel for publishing messages.
if __name__ == "__main__":

    # Note that these are loaded from a .env file in current working directory
    credentials = dotenv_values(".env")
    HOST, PORT = credentials["HOST"], int(credentials["PORT"])
    USERNAME, PASSWORD = credentials["USERNAME"], credentials["PASSWORD"]

    # Connection parameters for RabbitMQ
    pika_credentials = pika.PlainCredentials(USERNAME, PASSWORD)
    parameters = pika.ConnectionParameters(HOST, PORT, "/", pika_credentials)

    # Establish connection to RabbitMQ
    connection = pika.BlockingConnection(parameters)
    channel = connection.channel()
After establishing the connection, the code defines and declares a RabbitMQ exchange named science_event. This exchange is used to route messages to the appropriate queues based on the routing key.
    # Declare an exchange
    exchange_name = "science_event"
    channel.exchange_declare(exchange=exchange_name, exchange_type="topic")
Finally, the code defines a function to generate random locations and utility scores. The utility scores are generated using a parabolic curve, which is calculated based on the current time step.
    try:
        while True:
            # event trigger
            eventRand = random.randint(100)
            if eventRand <= 99:  # the percent chance an event will occur

                # event location
                eventLat = random.uniform(-180, 180)
                eventLon = random.uniform(-90, 90)

                # loop for utility function
                for i in range(10):

                    # science utility function
                    utility = -((i / 10) ** 2) + 1
                    currentTime = datetime.now()
                    currentTime = currentTime.strftime("%H:%M:%S")

                    # publish event utility message
                    eventMessage = {
                        "time": currentTime,
                        "latitude": eventLat,
                        "longitude": eventLon,
                        "utility": utility,
                    }

                    routing_key = "BCtest.AIAA.eventUtility"
                    message_body = json.dumps(eventMessage)
                    channel.basic_publish(
                        exchange=exchange_name,
                        routing_key=routing_key,
                        body=message_body,
                    )
                    print(eventMessage)

                    # wait for next utility step
                    time.sleep(1)

            # time step between possible events
            next_step = datetime.now() + timedelta(seconds=5)

            # allows application to be stopped with GUI every second
            while datetime.now() < next_step:
                time.sleep(1)

    except KeyboardInterrupt:
        print("Stopping publisher...")
    finally:
        connection.close()
        print("Connection closed")
Science Event Dashboard
The Science Event Dashboard is a visualization tool that subscribes to the messages published by the Science Event Publisher. It uses the Python Dash library to create a web-based dashboard that displays the utility scores and locations in real-time.
The first section of the code includes import statements that bring in the necessary dependencies for building the dashboard application.
import json
import threading

import dash
import pandas as pd
import pika
import plotly.express as px
from dash import dcc, html
from dash.dependencies import Input, Output
from dotenv import dotenv_values
The function on_message handles incoming messages from the RabbitMQ event broker. It processes the message, extracts the utility score and location data, and updates the dashboard’s data store.
def on_message(ch, method, properties, body):
    """
    Callback to process an incoming message and then run the update_fig function.

    Args:
        ch: The channel object.
        method: The method object.
        properties: The properties object.
        body: The message body.
    """
    eventMessage = json.loads(body.decode("utf-8"))
    eventMessage["location"] = eventMessage["latitude"], eventMessage["longitude"]
    eventLOD.append(eventMessage)
    update_fig(n)
The function update_fig is responsible for updating the dashboard’s figure with the latest data. It creates a scatter plot of the utility scores and locations, allowing users to visualize the science event data in real-time.
def update_fig(n):
    """
    Updates the dashboard when new data is received.
    """
    if not eventLOD:  # Check if eventLOD is empty
        # Return the initial figure with empty data but defined columns
        return px.line(
            pd.DataFrame({"time": [], "utility": []}),
            x="time",
            y="utility",
            labels={"time": "time", "utility": "utility (n.d.)"},
            title="Science Event Utility (Waiting for data...)",
        )
The function start_consumer is a blocking function that starts consuming messages from the RabbitMQ event broker.
def start_consumer():
    """
    Start consuming messages in a separate thread
    """
    channel.start_consuming()
The code establishes a connection to the RabbitMQ event broker using the provided environment variables in a .env file. It uses the pika library to create a connection and a channel for publishing messages.
if __name__ == "__main__":

    # Note that these are loaded from a .env file in current working directory
    credentials = dotenv_values(".env")
    HOST, PORT = credentials["HOST"], int(credentials["PORT"])
    USERNAME, PASSWORD = credentials["USERNAME"], credentials["PASSWORD"]

    # Connection parameters
    pika_credentials = pika.PlainCredentials(USERNAME, PASSWORD)
    parameters = pika.ConnectionParameters(
        HOST,
        PORT,
        "/",
        pika_credentials,  # ssl_options=pika.SSLOptions()
    )

    # Establish connection to RabbitMQ
    connection = pika.BlockingConnection(parameters)
    channel = connection.channel()
After establishing the connection, the code defines and declares a RabbitMQ exchange named science_event. This exchange is used to route messages to the appropriate queues based on the routing key.
    # Declare the exchange
    exchange_name = "science_event"
    channel.exchange_declare(exchange=exchange_name, exchange_type="topic")
The code then declares a queue and binds it to the science_event exchange. This queue will receive messages published by the Science Event Publisher.
    # Create a queue with a random name
    result = channel.queue_declare("", exclusive=True)
    queue_name = result.method.queue

    # Bind the queue to the exchange with a routing key
    binding_key = "BCtest.AIAA.eventUtility"
    channel.queue_bind(
        exchange=exchange_name, queue=queue_name, routing_key=binding_key
    )
A basic consumer is then set up to listen for messages on the queue. When a message is received, it calls the on_message function to process the message and update the dashboard.
    # Set up the consumer
    channel.basic_consume(
        queue=queue_name, on_message_callback=on_message, auto_ack=True
    )
A dataframe is created to store the utility scores and locations, which will be used to update the dashboard’s figure.
    # initialize df
    df0 = pd.DataFrame()
    latitude = 0
    longitude = 0
    df0["latitude"] = 0
    df0["longitude"] = 0
    df0["time"] = 0
    df0["utility"] = 0
    df0["location"] = (latitude, longitude)
    n = 0
    eventLOD = []
Finally, the code sets up the Dash application layout and starts the consumer in a separate thread to allow the dashboard to run concurrently with message consumption.
    # Start consuming in a background thread
    consumer_thread = threading.Thread(target=start_consumer)
    consumer_thread.daemon = True
    consumer_thread.start()

    app = dash.Dash(__name__)

    # for dashboard plot
    fig = px.line(
        df0,
        x="time",
        y="utility",
        color="location",
        markers=True,
        labels={"time": "time", "utility": "utility (n.d.)"},
        title="Science Event Utility",
    )

    app.layout = html.Div(
        [
            dcc.Graph(id="Utility_Plot", figure=fig),
            dcc.Interval(id="interval-component", interval=1 * 1000, n_intervals=0),
        ]
    )

    app.callback(
        Output("Utility_Plot", "figure"), Input("interval-component", "n_intervals")
    )(update_fig)

    app.run(debug=True)
Execution
The Science Event Dashboard Test Suite runs outside of the NOS-T tools library, so it does not use the standard NOS-T YAML configuration file. Instead, it requires a custom environment file (.env) to configure the RabbitMQ event broker connection.
Setting Up Environment File
For this test suite, you will need to use an IDE to create a file with the
name .env containing the following information:
HOST="your event broker host URL"
PORT="your connection port"
USERNAME="your event broker username"
PASSWORD="your event broker password"
If you are running the test suite on your local computer using a local RabbitMQ event broker, you can set up the .env file like this:
HOST="localhost"
PORT=5672
USERNAME="admin"
PASSWORD="admin"
Note
For details on setting up a local RabbitMQ broker, refer to the RabbitMQ Broker on Local Host guide.
Executing the Science Event Dashboard Test Suite
Next, run each application on separate computers or consoles using the following commands:
Run the Dashboard application:
python3 scienceEventDashboard.pyRun the Publisher application:
python3 scienceEventPublisher.py
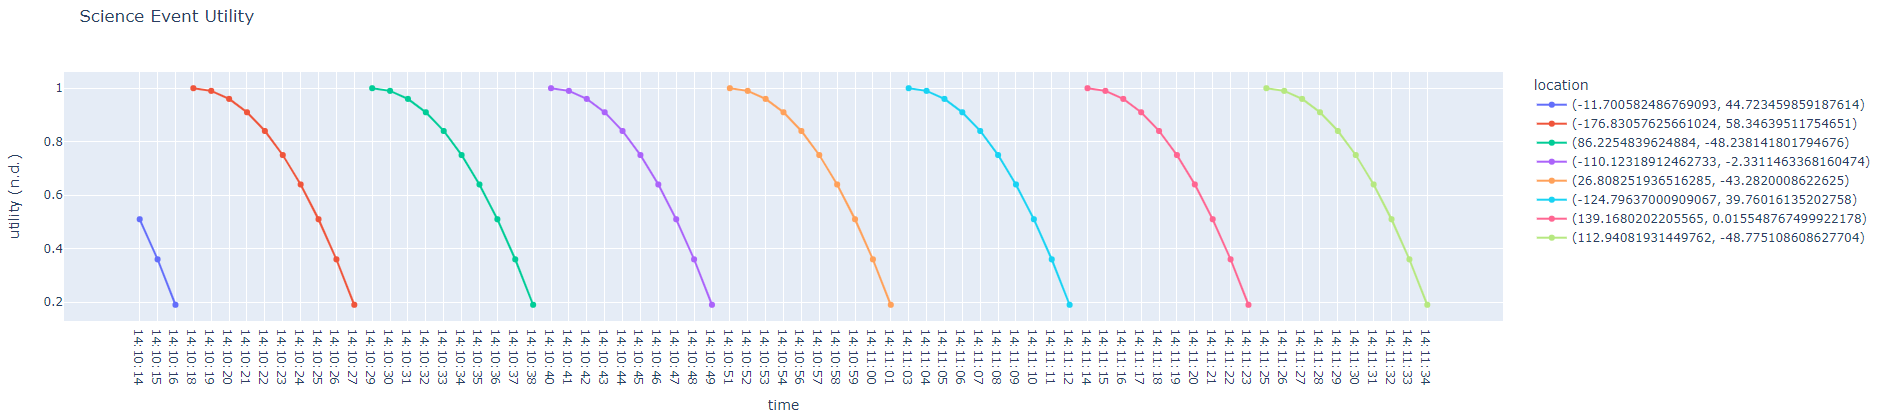
Wherever the dashboard application is running, you should be able to see the utility scores from a web browser (default address: http://127.0.0.1:8050/). If everything is running properly the dashboard will look like the figure below:
Conclusion
This example demonstrates how to build a basic visualization tool using a pub/sub architecture with RabbitMQ, outside of the NOS-T Tools library. The Science Event Dashboard Test Suite provides a simple yet effective way to visualize science event data, helping users understand data flows and behaviors within a test suite.
Some good next steps for learning other NOS-T functions and developing your own test suites can be found at the following links: