Visualizations
This test suite contains two types of dynamic visualizations, both of which are unmanaged applications. Although these are used in conjunction with the managed applications of this test suite, they do not subscribe to Manager messages. These applications are strictly subscribers, they do not publish any messages to any topic endpoints on the message broker.
CesiumJS Scoreboard
This application is essentially the same as the FireSat+ Scoreboard. The same Cesium access token and env.js file can be used in conjunction with this scoreboard, although this example adds PREFIX as another environment variable which enables more dynamic and extensibile use cases.

Screenshot of Scoreboard Displaying Missed Downlink Opportunity
Because there are no fires or events to detect, the sensor circles representing the instrument field of view are omitted from this scoreboard. Ground stations that are active appear as pink points with inverted cones representing the minimum elevation angle for establishing communication links. When a ground station outage occurs, the cone disappears and the pink point changes colors to light gray. When operations are restored at the ground station, the point reverts to pink and the inverted cone reappears.
The purpose of this test suite is to highlight cases exactly like what is displayed in the latter figure. In this example, a satellite passing over the US mainland is just out-of-view of a ground station in Ohio. It would be in view of the ground station in California, but that station is currently experiencing an outage, requiring the satellite to wait until the next downlink opportunity to offload stored mission data.
SatelliteStorage State Dashboard
This application demonstrates a plotly dashboard for tracking hard-drive state and cumulative costs for the downlink example case.
The application is an implementation of the dash Python package similar to the Science Event Dashboard but with some additional plot types and other customizations.
- downlinkDashboard.on_message(method, properties, body)
Callback method that processes messages on relevant topic endpoints for regularly triggering dashboard display updates.
- Parameters:
mqttc (
MQTT Client) – Client that connects application to the event broker using the MQTT protocol. Includes user credentials, tls certificates, and host server-port information.obj – User defined data of any type (not currently used)
msg (
message) – Contains topic the client subscribed to and payload message content as attributes
- downlinkDashboard.update_capacity()
Updates the capacity plot with most recent states as reported along with location data on the {PREFIX}/satelliteStorage/location topic endpoint.
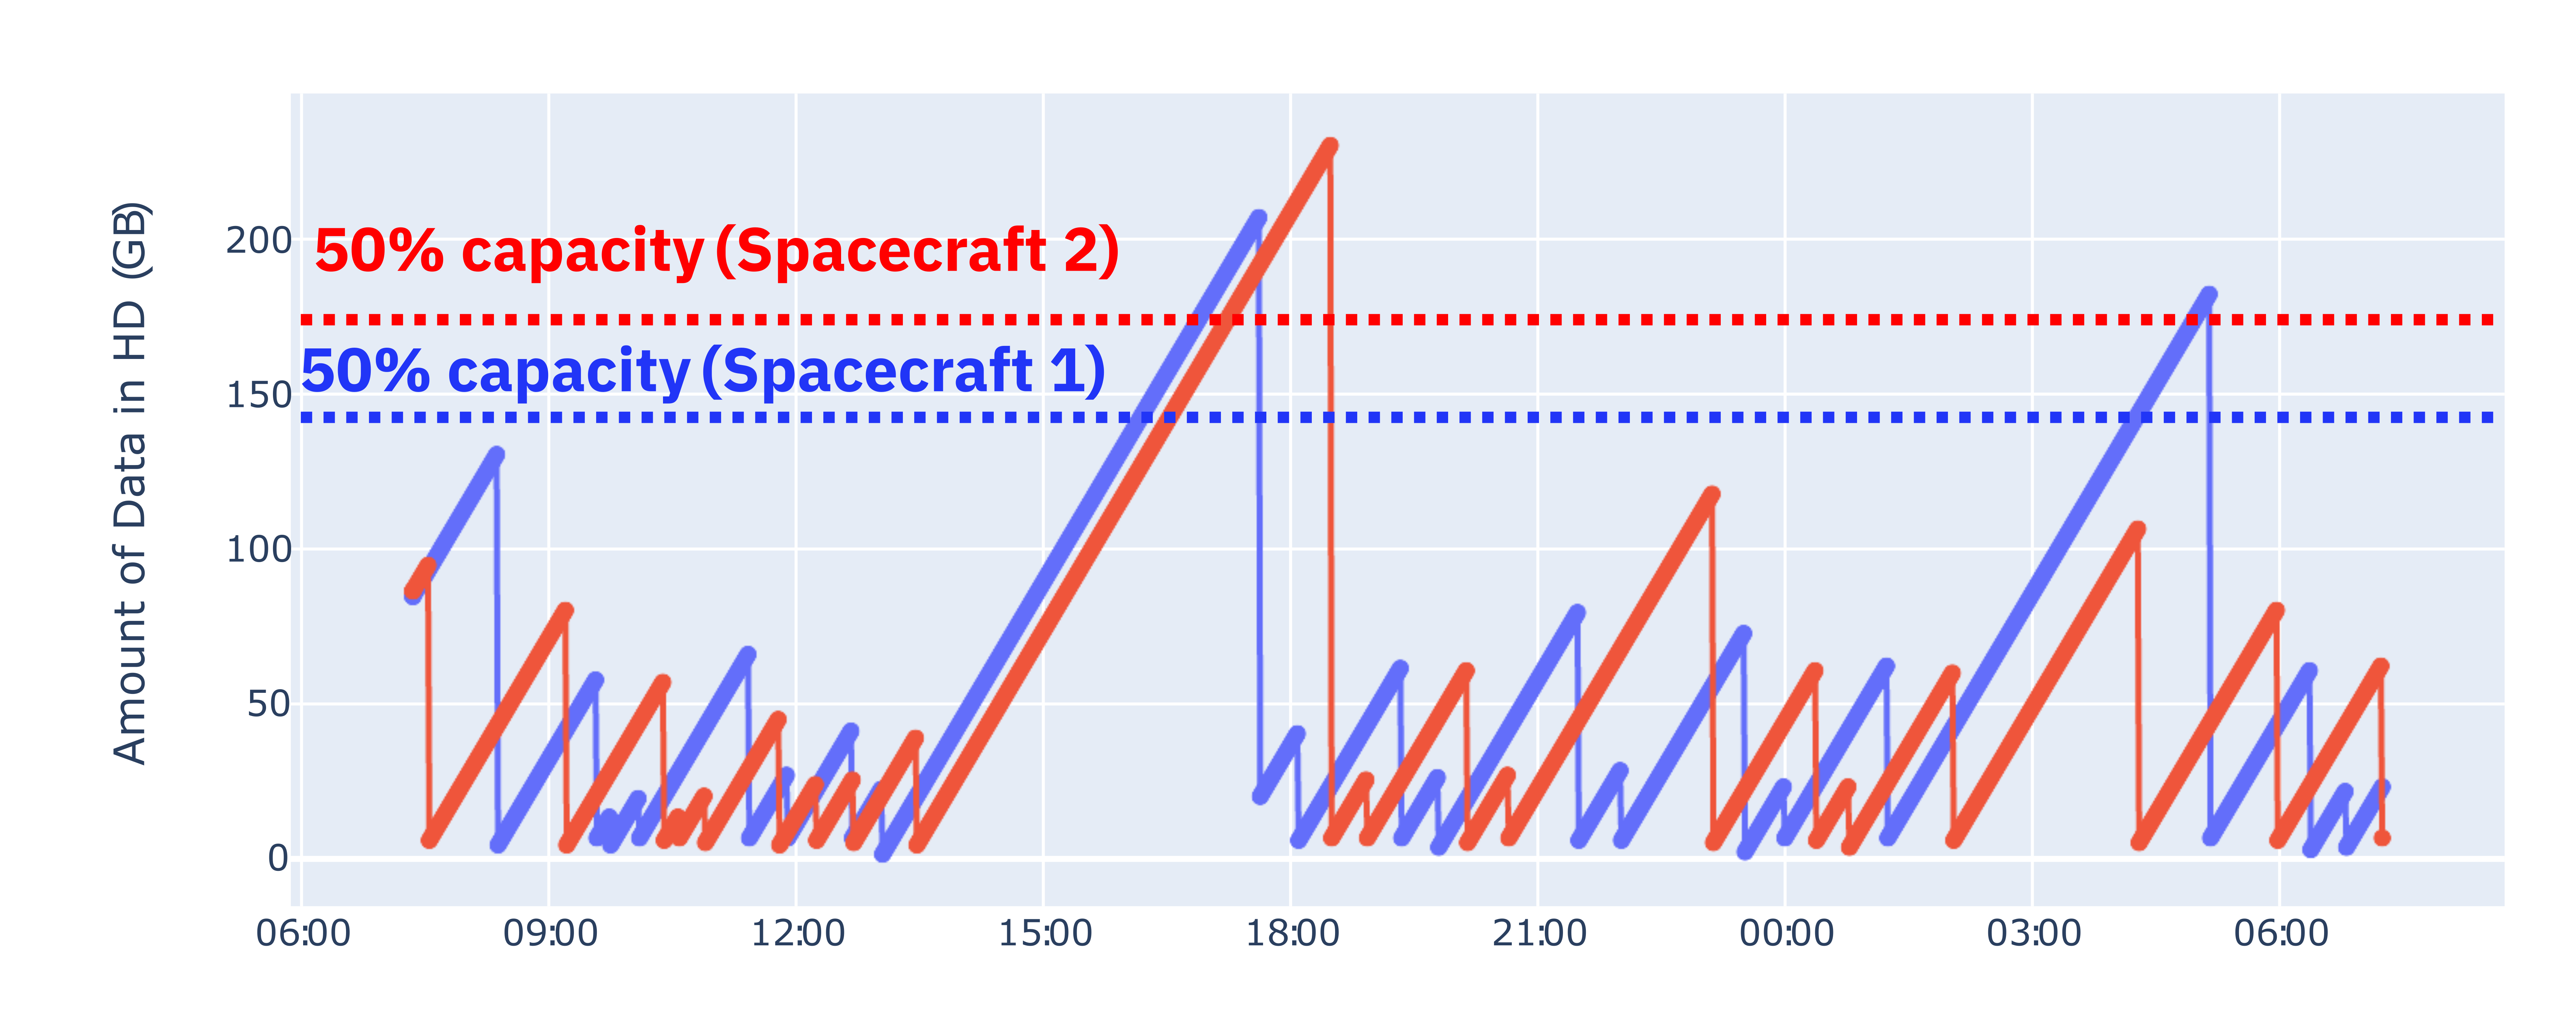
Example Dashboard Display Updating Satellite Storage Capacity Used
- downlinkDashboard.update_cost()
Updates the cost plot with most recent states as reported along with location data on the {PREFIX}/satelliteStorage/location topic endpoint.
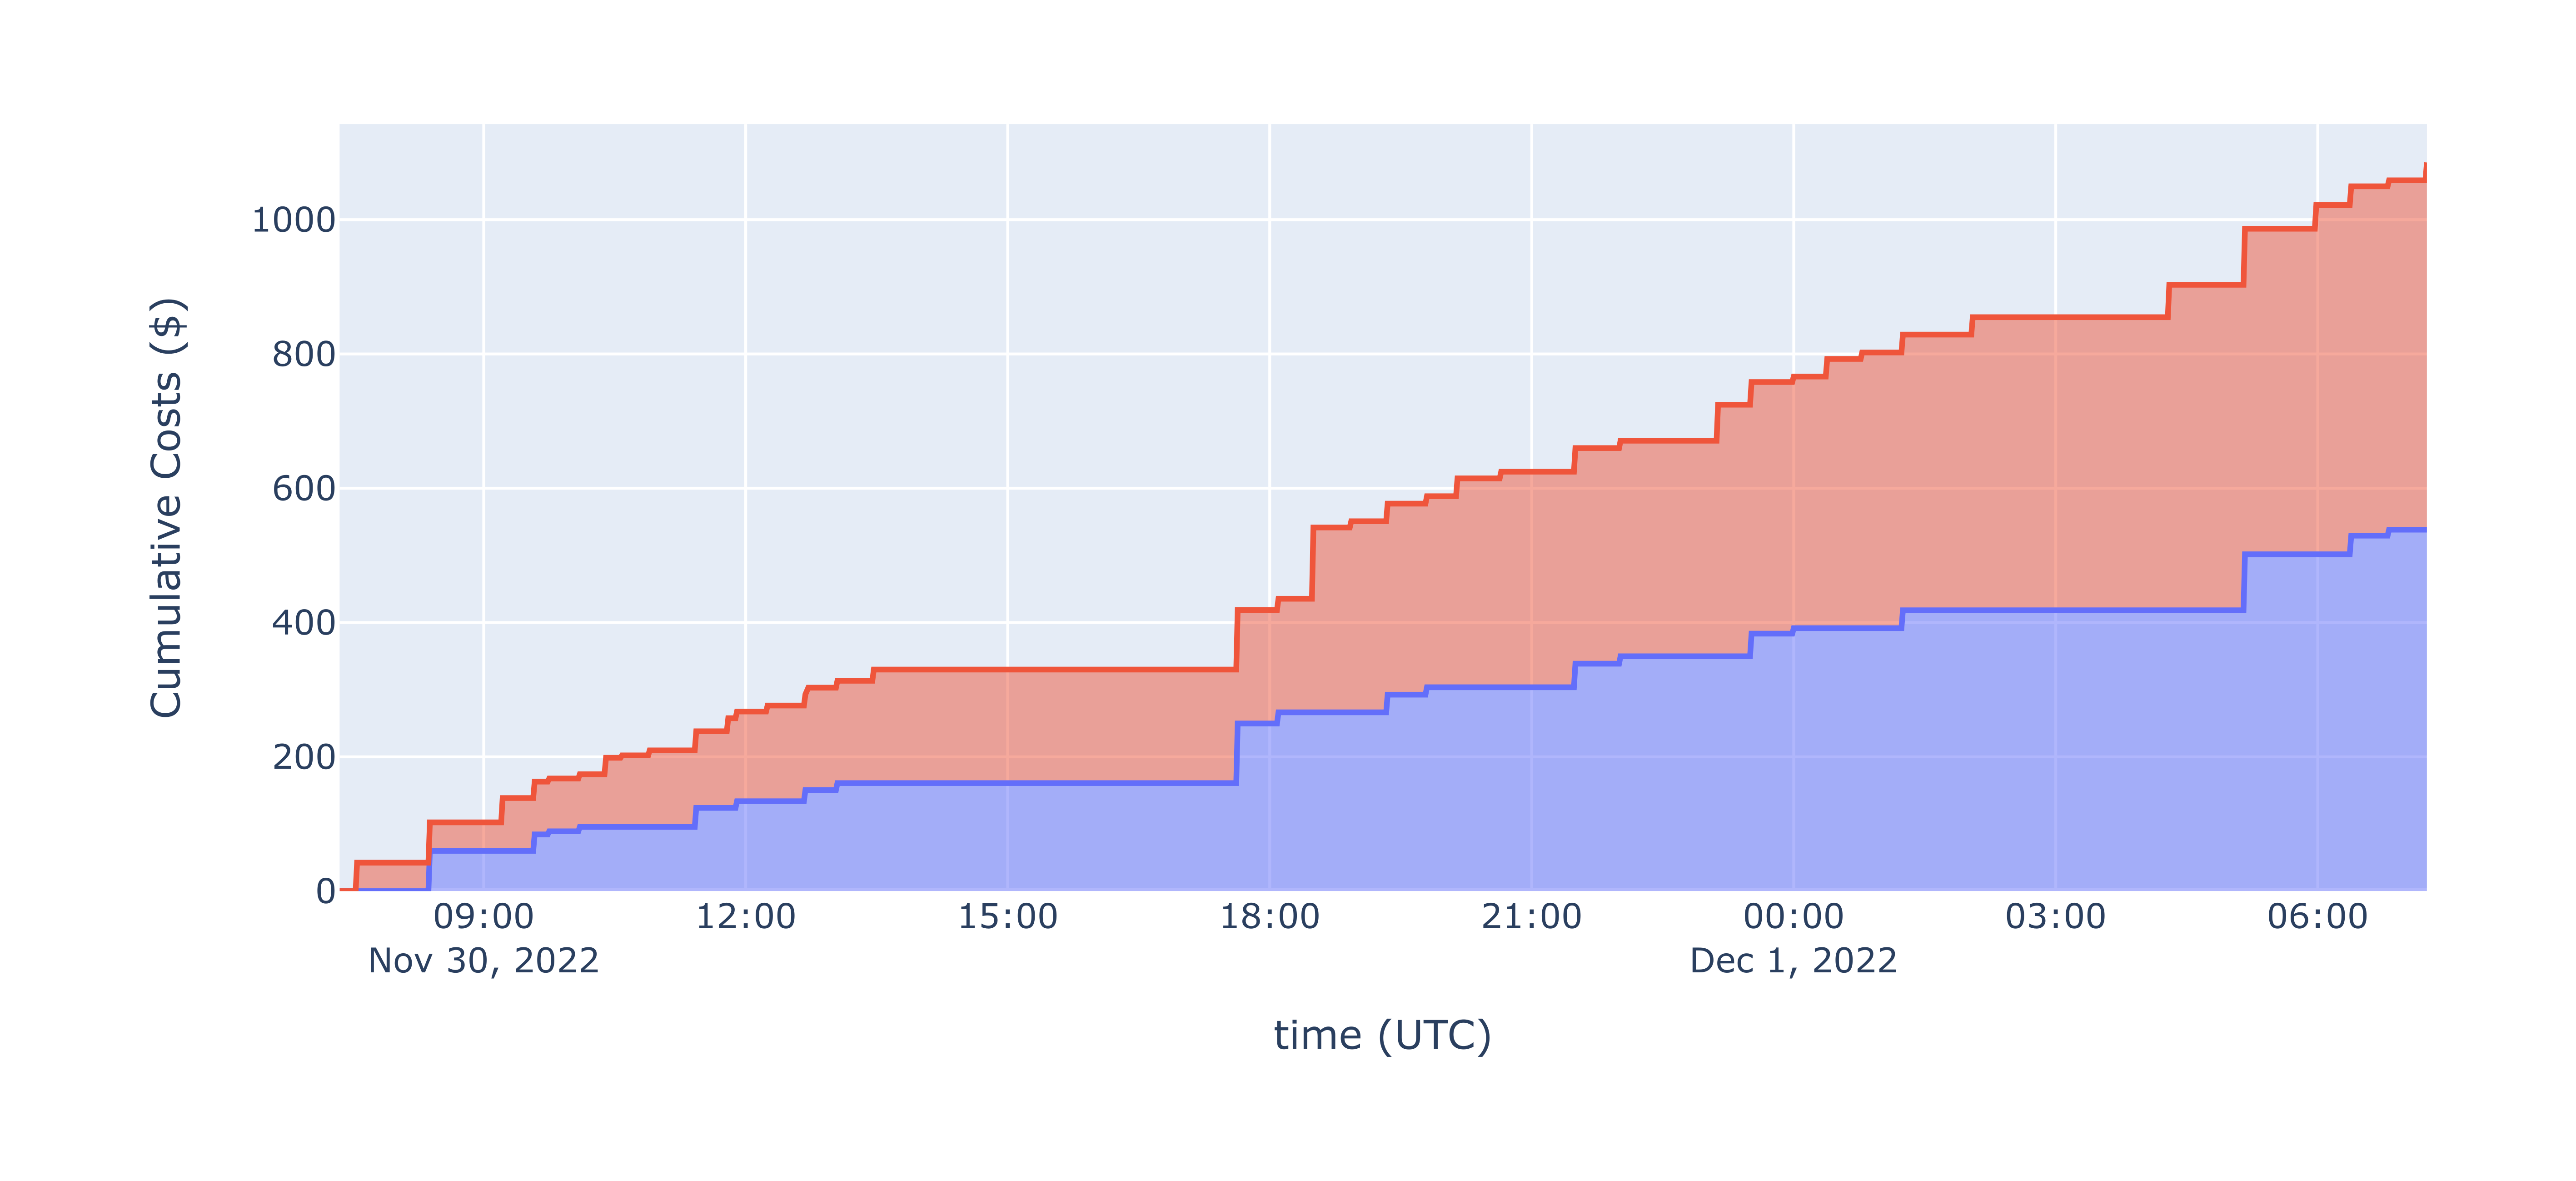
Example Dashboard Display Updating Satellite Costs Incurred
- downlinkDashboard.disable_dash()
Boolean switch for enabling/disabling the dashboard plots from updating.