Scoreboard
Unmanaged application written in JavaScript leveraging the CesiumJS platform to visualize FireSat+ test cases.
The Scoreboard application gives a geospatial view of the mission. This and other mission visualization appliations have been essential for ensuring that test cases are behaving as intended. Running the Scoreboard requires a CesiumJS account, access token, and the Blue Marble asset.
Cesium Access Token and Assets
The Scoreboard uses the Cesium geospatial visualization tool which requires getting an access token. You will get an access token by signing in at the following link:
https://cesium.com/ion/signin/tokens
After creating an account, you must add the Asset “Blue Marble Next Generation July, 2004” from the Asset Depot (ID 3845) to the account assets to enable visualization.
env.js file
The Scoreboard application pulls credentials from a JavaScript file named “env.js” containing the following information:
var HOST="your event broker host URL"
var PORT=15670
var USERNAME="your event broker username"
var PASSWORD="your event broker password"
var TOKEN="your Cesium token (see Cesium installation instructions)"
scoreboard.html
This is the main file for the Scoreboard application and can be run in a regular web browser. There isn’t a separate config file like the other FireSat+ applications. The detailed description for scoreboard.html is commented in the code.
Cesium resources
The CesiumJS documentation contains descriptions of the different functions. Also, the Cesium “Sandcastle” sandbox environment is useful for rapid testing of these functions. Note that you will not be able to copy-and-paste the Scoreboard code directly into Sandcastle due to fundamental differences between it and the NOS-T event-driven architecture. However, the Sandcastle envrionment is useful for testing out the different visualization functions statically, and generating code snippets, before implementing them into a NOS-T application.
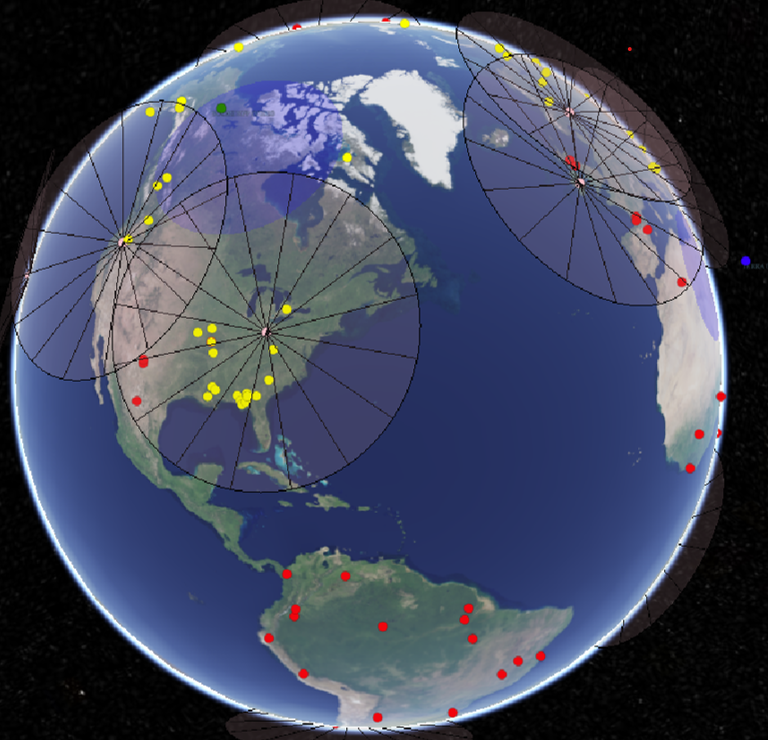
Screenshot of Scoreboard Displaying Fire States, Satellite Views, and Ground Locations
The latter figure is an example view of the Scoreboard during a simulation. The yellow (detected) and red (ignited) dots represent fires. The pink dots and cones represent ground stations and their minimum elevation angles for establishing comms and data links. The blue dots represent the locations of the spacecraft and the blue circles projected on the Earth’s surface show what is visible given the satellite instrument’s field of view. The blue dots turn green when the satellite moves into view of a ground station.