Visualization Implementation Example
The Science Event Dashboard Test Suite is a simple example of NOS-T capabilities. It does not require the use of the NOS-T tools library. It contains two applications, a Science Event Publisher and Dashboard. Importantly, it uses a dashboard to visualize data being sent over the testbed. The development team has found visualization tools like this to be essential in ensuring test suites are functioning as intended.
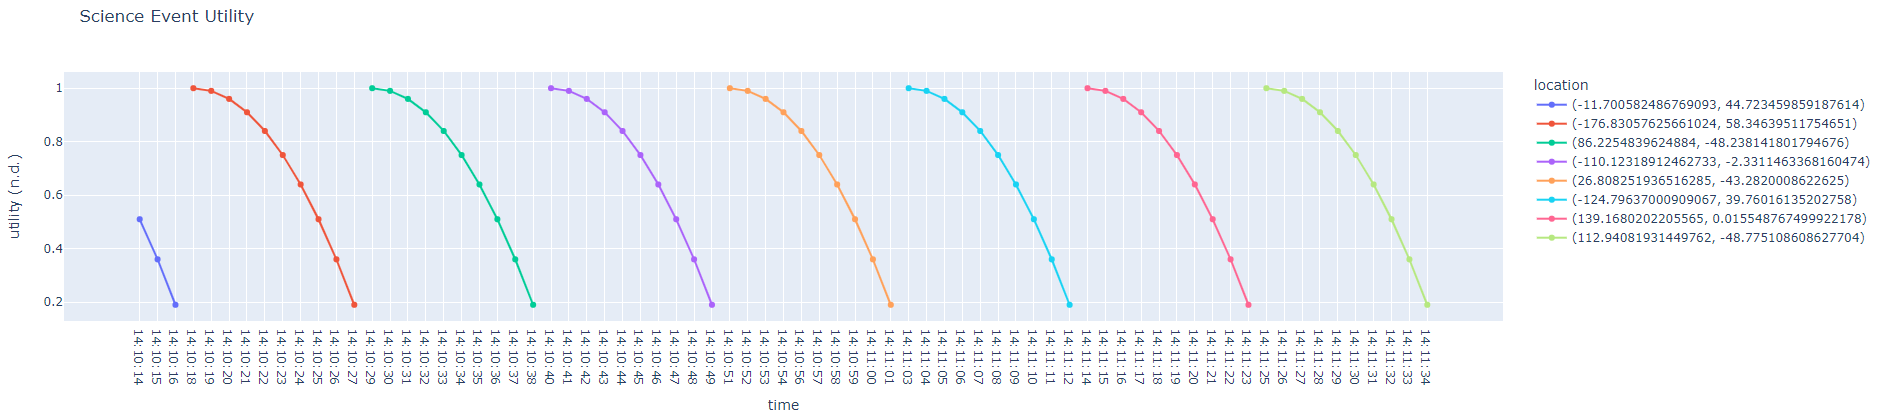
The Science Event Publisher regularly publishes a utility score and globally distributed random location. The utility scores follow a parabolic curve from the apex down to zero for each time step. The second application is a basic dashboard which publishes the utility and location with the Python Dash library. The development team has found visualization tools like this dashboard to be very helpful to ensure that test behavior is as expected. A basic graphical representation of the data flow is shown below.

In order to run the Science Event test case you first need to get the two applications which comprise this test suite. The entire set of NOS-T tools and examples are available at the main GitHub page. However, because this example doesn’t require the tools api, just the two necessary applications are found at the Science Dashboard GitHub repository.
More in-depth descriptions of what the code is doing can be found here: NOS-T Science Event Test Suite.
Initial Requirements
This test suite assumes that you have first downloaded the constituent applications. It is also necessary to install several python packages as found in the requirements file. However, this is an unmanaged NOS-T test suite and it is not necessary to have the tools library installed.
Setting Up Environment Files
In order to protect your (and our) information, these applications use an environment file for usernames, passwords, event broker host site URLs, and port numbers.
For this test suite you will need to use a text editor to create a file with the name “.env” containing the following text. Make sure that you “Save as type” “All files” and not as a text file.
HOST="your event broker host URL"
PORT=8883 - your connection port
USERNAME="your event broker username"
PASSWORD="your event broker password"
Both applications must have this file in the home path (folder). If they’re both in the same folder then just one is sufficient.
Running a Test Case
Next, run each application on separate computers or consoles. Wherever the dashboard application is running, you should be able to see the utility scores from a web browser (default address: http://127.0.0.1:8050/). If everything is running properly the dashboard will look like the figure below: